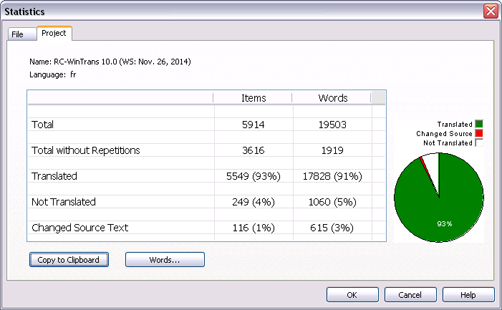
The
name of the project's active target language is displayed at the
top of the page as well as the name of the current translation
project.

|
Translation
Status Information Table |
The
translation status information is organized into a table. This
information is applied to both the
and to the words contained in the current project:
Table
data:
· |
Total
The total number
of translation units or words contained in the current
project. |
· |
Total without Repetitions
The total number of translation
units or words contained in the current project disregarding
repeated entries (i.e., only one occurrence of identical
entries is taken into account). |
· |
Translated
The total number
of translation units or words in the current project that
has already been translated. Note that "translated"
simply means that an entry exists in the target text. |
· |
Not Translated
The total number of translation
units or words in the current project for which no translation
exists. |
· |
Changed Source Text
The total number
of translation units or words contained in the current
project for which the source item has . |

|
Translation
Status Pie Charts |
The
translation status information table is supplemented by pie charts
providing a visual representation of the percentage of translated,
non-translated, and changed items in the current project or group.

|
Command
Buttons |
· |
Copy to Clipboard
Copies
the data from the "Translation Status Information
Table" to the clipboard along with the name of the
project and target language.
|
· |
Words
Opens the
Words dialog where
a numbered list of all the words contained in the translation
project is shown along with the total number of occurrences
found for each one. |
|
